Philippines Toolkit: AYSRH Advocacy
Data Use for Decision-Making

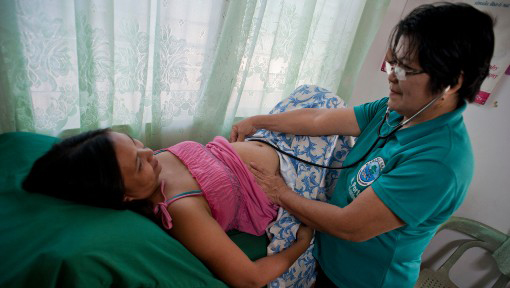
Dr. Ric Panganiban, City Health Officer of Puerto Princesa City checks the city health data reports with Analiza Herrera, Population Officer, and city health office staff. (Photo source: ZFF).
All stakeholders and partners of The Challenge Initiative (TCI) use data in all aspects of program implementation to design and develop interventions, track and monitor program progress, and evaluate changes that occur because of program implementation, and assess high-impact reproductive health interventions for scale-up.
TCI uses quality data to adjust program strategy implementation and management, for learning and adaptation of high-impact interventions, and scaling up. Data can make a compelling case for advocacy to support adolescent and youth sexual and reproductive health (AYSRH) and engage LGUs and community members to own the issues faced by adolescents and youth.
Evidence-based planning and decision making and learning and adaptation can occur only if (1) sex and age-disaggregated data are available; (2) data provides practical information addressing the needs of its users; (3) data management is feasible, realistic, and cost-effective; (4) data used ethically and with high regard for those impacted by the results; and (4) accurate and good quality.
What are the benefits of this approach?
- Prioritizing data collection, analysis and use fosters a culture of learning and continual improvement within an organization, facility, school or community.
- Regular data analysis and review allows us to make course corrections in a timely manner and focus attention on interventions that have the biggest impact.
- Capturing relevant data helps tell the story of a program’s progress, which may be essential for continued resource allocation and support.
- Data management and use is an area of programming that provides opportunities for partnership with young people. Young people are often best placed to collect data from their peers and can work with program implementers to do so. In return, young people learn research and data analysis skills that benefit them.
- Analyzing data before a program begins sets the stage for a cost-efficient and effective program as its targeted towards the correct sub-populations. Continual monitoring and evaluating with sound data ensure that programs remain responsive to young people; without this, programs may replicate interventions that are out of touch with young people’s needs and realities.
How to implement
Step 1: Identify the purpose and scope of data
The adoption of TCI’s theory of change and logical framework defines intervention and focuses on reproductive health and family planning. Adaptability of the theory of change and the logical framework must be reviewed according to national and local policy relevance, and local context and realities.
Understanding the stakeholders that will be directly and indirectly be affected or will benefit from the intervention is important in determining the purpose and scope of data, as their interests will guide the development of the intervention’s monitoring and evaluation plan. Their roles and interests in the program implementation will determine the data to be collected, how data will be utilized, how they can facilitate or hinder data management, and their objectivity in the interpretation and use of the results.
For tools on conducting stakeholder assessment in AYSRH refer to the following approaches: Community Gatekeepers, Youth Audience Segmentation, Youth Engagement, Information and Service Delivery Network, Parent Engagement.
While stakeholder assessment is regularly done during program design, iterative stakeholder assessments are critical to check changes in assumptions and risks in engaging stakeholders for AYSRH.
Step 2: Planning data management
Once stakeholders’ interests and their roles in the program design and data management processes are analyzed, developing the data management plan, also known as the monitoring and evaluation plan, comes next.
The data management plan should show the expected results in relation to its goals and objectives, describes the data needed, how data will be collected and analyzed, how this information will be used, the resources that will be needed in data collection, analysis, and when data will be reported or feedback to stakeholders.
Refer to Leadership approaches on how to link data management with leadership approaches.
Step 3: Use data to inform program design
Part of data management planning is understanding the data. Often data exists and is available. Tools used in TCI contain relevant data used in all phases of program design, monitoring, and evaluation. In reviewing the existing data, consider: What does the existing data tell us?
- Are young people’s voices in the existing data? If not, how can we capture them?
- Which sub-groups of young people are “invisible” in the existing data sets?
- Does the data available speak to the realization of young people’s sexual and reproductive rights, including informed consent and aligned to existing data privacy policies?
Expression of Interest
Local stakeholders should review and use existing data in submitting their Expression of Interest (EOI) and to inform their Program Design, which lays the groundwork for understanding the landscape and existing gaps that the local government unit (LGU) hopes to address.
RAISE tool
Many LGUs will find it useful to use TCI’s Reflection and Action to Improve Self-reliance and Effectiveness (RAISE) tool as part of the program design stage and landscaping. This will allow the LGU and TCI Program Implementation Team (PIT) to assess the completeness, timeliness, and accuracy of the FHSIS as a primary data source for monitoring and evaluating TCI programming; see domain 2.4-2.6 (Pages 14-17) of the RAISE tool.
Data Profiling Information
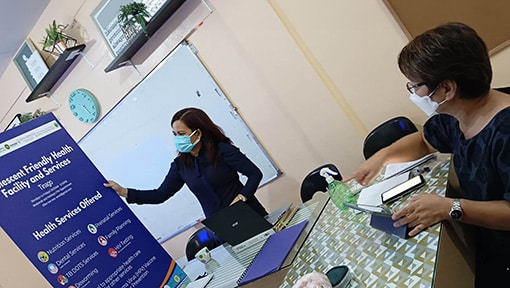
Certain national policies require regular profiling of adolescents and youth in the community, to include community registration, individual youth profiling, and even health facility client lists. Check with the LGU or the health facility if access to information is allowed and can be used for program design and development. As there may be existing national policies on data use and data privacy, double check how access to such information may require informed consent from actual individuals, or other permissions to ensure ethical use of data. Please note that for approaches to service delivery, voluntarism and informed choice for family planning has to be observed and respected, thus, deliberate targeting of individuals for particular methods is not allowed and recommended. Refer to approaches on Adolescent and Youth-Friendly Health Services (AYFHS) and ISDN.
Systems Roadmap
Systems roadmap is a management and monitoring tool to aid LGUs in the analysis of system gaps and increased accountability towards achievement of outcomes as opposed to mere activity implementation. The roadmap details system level indicators to achieve or maintain adolescent and youth friendly cities. The technical roadmap is used during leadership and technical sessions to surface adaptive and technical issues of local governments in ASRH. See the Leadership approaches.
Data Gathering through FGDs and KIIs
And, when interested and needed, conducting a few focus group discussions (FGDs) and key informant interviews (KIIs) with adolescents (in-school youth, out-of-school youth, etc.), significant adults, local health facility staff, etc. This may include:
- Parents
- Teachers
- Service providers
- Barangay officials
- Youth organizations
- Local Chief Executive/councilor for health
- Chief Health Officer
- Adolescent coordinators from health centers/facilities
- SK/LYDO officers
- Representatives from the church/media and other partner agencies
Step 4: Determine the program indicators
Assessing the state of family planning and AYSRH in a specific LGU requires not only baseline data but also knowledge of what data are available and how often. The Demographic Landscape Table, which is part of the landscaping analysis of the program design, helps to focus on key background indicators. These indicators may be useful in informing your AYSRH program can be found from:
- Service statistics from the Field Health Services Information System (FHSIS)
- High school attendance and dropouts (Division of Schools)
- Hospital delivery (City health office)
- Natality statistics (Local civil registrar)
- Existing survey data
In addition, you may want to consider reviewing recent qualitative studies, such as:
- USAID’s ReachHealth Project’s human-centered design activity with teens
- Breakthrough RESEARCH and De La Salle University’s Improving reproductive health and family planning outcomes among out-of-school adolescents and youth in the Philippines
Determine the indicators that need to be captured along with their data source and frequency. Note that the LGU might identify more indicators of particular interest in their locality. Based on the TCI proven interventions in the Philippines toolkit, these key performance indicators include:
| Indicator | Disaggregation | Data Source(s) |
| Number of pregnant adolescents and young adult women |
10-14, 15-19, 20-24 Gravida |
Health facility records |
| Number of adolescent girls and young adult women with repeat pregnancies |
10-14, 15-19, 20-24 Parity, Gravida |
Health facility records |
| City modern contraceptive prevalence |
10-14, 15-19, 20-24 Male, female |
Health facility records |
| Number of currently pregnant adolescents and young adult women who sought prenatal care in their first trimester |
10-14, 15-19, 20-24 Type of provider/ facility sought |
Health facility records |
| Number of currently pregnant adolescents and young adult women who were provided postpartum family planning counseling during pregnancy |
10-14, 15-19, 20-24 Type of provider who provided counseling Type/ name and location of facility sought |
Health facility records |
| Number of adolescents and young adult women who recently gave birth and provided postpartum family planning services |
10-14, 15-19, 20-24 Type of PPFP service provided Type/ name and location of facility sought |
Health facility records |
| Number of adolescent girls who dropped out of school due to pregnancy | 10-14. 15-19, 20-24 | School records, city population records |
| Number of adolescent girls who re-enrolled in school after giving birth | 10-14, 15-19, 20-24 | School records, city population records |
|
Number of health personnel trained in providing adolescent and youth-friendly health services
|
Type of health personnel (doctor, nurse, midwife, peer educator) | Health facility records |
|
Percentage of adolescent and youth-friendly health facilities (AFHF)
|
Level of certification (Level 1, 2, 3) Type of facilities (RHU, DOH retained hospitals, teen centers, others) | Regional AHDP reports |
| Number of health facilities completing AYSRH whole site orientation | Facility records/project records | |
| Number of adolescents and young adult women provided AYSRH services |
Disaggregated by service type (contraceptive method vs counseling) and by sex and age:
|
FHSIS; Facility register |
| Number of adolescents referred to secondary and tertiary facilities/ specialist care | Disaggregated by age, sex and service referred | Project records or ISDN Referral System Log |
| Number of adolescents who completed AYSRH referrals | Disaggregated by age, sex and service referred | Project records or Referral System Log |
| Number of local governments that conduct the RAISE tool for AYSRH | ||
| Number of youth leaders and influencers engaged in brgy, city, regional implementation meetings, strategy development, policy development, and budget reviews | This may include youth participation in TCI PIT meetings, ISDN consultation workshops, ISDN Secretariat meetings, facility quality improvement team meetings, SBC working group meetings, Quarterly Municipal Council Meetings, Data Review meeting, etc. | Government records |
| Number of community-level gatekeepers engaged in AYSRH |
Disaggregated by type:
|
Project records |
| Number of active youth influencers | This indicator measures the number of Youth (15-24) years who have received orientation on functioning as TCI Youth Influencer and continue to conduct their activities as planned. | Project records |
| Number of cities with improved systems roadmaps | Project records |
Means of measuring data and targets are set in the at the national level. In the Philippines, relevant sources are the RPRH Law M&E Framework, the Philippine Statistics Authority (PSA) databases, Department of Health’s National Objectives for Health (NOH), POPCOM’s Philippine Population Management Program (PPMP), POPCOM’s Basic Demographics Booklet, as well as the national surveys such as the National Demographic Health Survey (NDHS) or the Young Adult Fertility Survey (YAFS).
Step 5: Ensure that the indicators are understood by all the staff
All staff implementing TCI interventions should be oriented on all the data forms, definitions of key indicators and basic analysis of the data and indicators. Regular coaching should be given to all those who handle the data.
For those not directly handling the data, they should receive coaching on the importance of age-disaggregated data and encouraged to regularly review the data in an effort to promote a culture of data for decision-making for AYSRH programming.
Step 6: Ensure routine data collection, quality checks, and analysis
As TCI activities are implemented, a range of stakeholders, including service providers, data managers and TCI data managers, collect relevant data to track project implementation, service statistics, commodity supplies and broader health outcomes. Ensuring these data are of high quality is critical to making good decisions about resource allocation, planning and programming.
To ensure data is complete and accurate, TCI staff and partners implement routine data quality checks. For example, conducting data quality checks of routine service statistics and comparing them to project record data: if the trends in the two data sources are similar, then this validates the accuracy of the routine data. If the trends are not similar, then it can point to quality issues with the routine data, which can prompt us further to identify and address the problems.
Step 7: Regularly feedback data results to all stakeholders
Having a reporting schedule indicating the frequency of reporting, purpose of reporting, target audience, format and outlet of reporting, person responsible for report preparation and feed backing is important to determine the information needs of the stakeholders, possible costs in the data collection, type of data and the analysis needed, and the format of reporting (e.g., report dissemination through social media, TV and radio interviews, town hall meetings, community forums).
Routine feedback meetings provide a useful opportunity to share findings in a variety of ways for a variety of objectives. One objective that is important to scaling up TCI evidence-based approaches is advocacy for ASRH and family planning at provincial and national levels. A helpful method for sharing data to a wide variety of audiences is through data visualizations since people can process and understand information faster and better when presented visually than through text-based reports.
During these meetings, LGU/barangay and PIT members should review the data with TCI to:
- Identify potential programmatic shifts
- Assess and address data quality concerns
- Identify new capacity building opportunities to support or enhance data comprehension and analysis skills as well as foster a data use for decision-making culture among all TCI stakeholders
During these data review meetings, it is useful to communicate gaps in the data in a constructive manner, appreciating and acknowledging each person right in the beginning, followed by suggested improvements (offering additional coaching support or suggesting peer coaching, whatever may be required) instead of direct blaming. This approach boosts morale and provides directions for course correction. Refer to AYFHS, Youth Engagement, Parent Engagement approaches.
Indicators for success
- Mayors, community and youth leaders can explain analyzed data and show evidence of its utilization in all aspects of data management.
- Change in RAISE scores on domains 2.4-2.6 from baseline to quarterly implementation of the tool
- Using the system’s roadmap will show improvements in indicators (from red to yellow to green)
Resources needed
- Data collection would need staff who are competent to collect data effectively. Other resources needed would be the use of software (i.e., ODK) or electronic gadgets that can collect and store information.
- Dedicate resources to implement data management activities from data planning, collection, analysis, review and data quality checks, and feedback
- Meeting venue for data reviews should be part of regularly scheduled meetings. Equipment such as a laptop, projector and Microsoft software, such as Excel and PowerPoint, for ease of sharing data. Workshop materials may also be necessary such as manila paper, pens, metacards. In addition, there may be printing costs for handouts.
TCI APP USERS PLEASE NOTE
You will only receive CERTIFICATES by email – when earning a score above 80% – and will not be able to view or print a certificate PDF from the TCI app.
Test Your Knowledge
Earn a Certificate

Helpful Tips
- Data should not be collected for the sake of collecting data; its value lies in its potential to improve the quality of programs and services for young people.
- Plan from the beginning how best to communicate the data collected to all levels of implementers and the communities being served by the interventions. Examples include public forums to share information with program participants (e.g., young people, parents, community leaders); meetings with service providers to discuss client data; or client-provider liaison committees used to interpret data and discuss programmatic implications.
- When discussing results, focus on objective findings, rather than interpreting with opinion or conclusion so as not to introduce bias
- Acknowledge any biases, assumptions, hypotheses and limitations in analyzing and reporting data.
- Feedback and supportive supervision using data should be provided to individual staff from their supervisors at each level.
- Line and bar graphs should be produced and displayed each month and at the end of the year in the local health office.
- Feedback including bar charts and graphs showing comparative performance and performance over time should be provided for all facilities.
Challenges
- The lack or inconsistency in the collection, utilization of reporting on AYSRH data. This requires LGU commitment and leadership to foster a culture of data use for decision-making in which timely, complete and accurate data is required.
External Resources
- POPCOM guide on understanding demographic indicators
- ReachHealth’s research reports